Usage
Graphic User Interface
Please read through this user guide before starting to use GMM Demux. When you meet with errors, please first make sure that the data meets the requirements and all steps are operated correctly. If still the errors occur, you can try to check the logs by selecting from menu Tools -> View logs. In case that you do not understand Python, or you think that the error is a bug, you may find the log file by selecting from menu Tools -> Open log file location and send this log file along with your system information to us on Github.
0. Example Data
GMM Demux has provided with an example dataset to work on.
If you installed GMM Demux on Windows, the example data is under %LOCALAPPDATA%\Programs\GMM-Demux\Example, or <Install Path>\GMM-Demux\Example if you chose to install in a custom path.
An example cell hashing dataset is provided in the
example_input/outs/filtered_feature_bc_matrixfolder.An example set of hand-curated putative cell types of the above dataset are provided in the
example_cell_typesfolder. Cell types are annotated through manual gating using surface marker expression data.An example csv format of the above cell hashing dataset is provided as the
example_hto.csvfile.
Instructions below are using the example dataset.
1. Data Input
Original data may be read from either directory containing matrix files from the cellRanger pipeline or a single csv file.
Matrix Files
The matrix files directory structure should look like:
example_input
├── barcodes.tsv.gz
├── features.tsv.gz
└── matrix.mtx.gz
To input from matrix files, either click the Read button on the right-bottom panel or select from menu File -> Add mtx file directory.
CSV File
The single csv file should look like:
HTO_1 |
HTO_2 |
HTO_3 |
… |
|
|---|---|---|---|---|
GEM_1 |
49 |
626 |
24 |
… |
GEM_2 |
58 |
14 |
580 |
… |
… |
… |
… |
… |
… |
To input from csv file, select from menu File -> Add from csv.
Full Report
Reading from full report can only use the estimator. If you want to draw plots, original data should be input.
The full report should be generated from the classifier and the directory should look like:
gmmd-full-report
├── GMM_full.config
└── GMM_full.csv
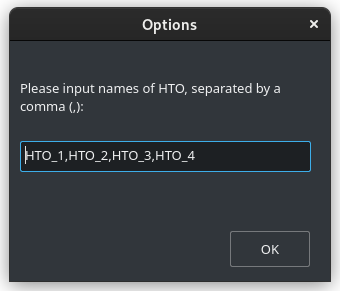
2. Specify HTO tags
After selecting data to input, GMM Demux will prompt an input box. User should type a list of sample tags (HTOs) separated by a comma (,) without whitespace.
For example, there are four sample barcoding tags in the example cell hashing dataset.
They are HTO_1, HTO_2, HTO_3, HTO_4. The <HTO_names> variable therefore is HTO_1,HTO_2,HTO_3,HTO_4.
Here is an example screenshot:
Then the input data will be shown in the GEM data tab.
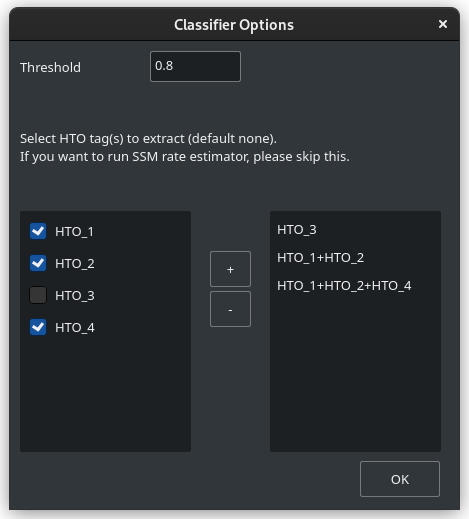
3. Classify
To run the classifier, either click Classify on the right-bottom panel, or select from menu Run -> Classify, or use the keyboard shortcut F6.
In the classifier option window, you may adjust the threshold value which is 0.8 by default.
If you want to extract specific HTO tags, select a single tag or multiple tag names and click + button to add single/multiple tag samples. To remove a sample, select the sample name and click - button. Estimator will not be available if extraction is selected, so leave the right panel clear if you want to run MSM and SSM rate estimator.
Here is an example screenshot with extraction enabled:
After the classification is done, the result is printed in the Classification Result tab.
To save MSM-free (SSD) results, either right click any region in Classification Result -> Save MSM-free results or select from menu File -> Save MSM-free results…. The result directory will look like:
SSD-mtx
├── barcodes.tsv.gz
├── features.tsv.gz
└── matrix.mtx.gz
To save full report, either right click any region in Classification Result -> Save full report or select from menu File -> Save full report…. The full report can be imported without reading original data to estimate MSM and SSM rate. The full report directory will look like:
gmmd-full-report
├── GMM_full.config
└── GMM_full.csv
To save simplified report, either right click any region in Classification Result -> Save simplified report or select from menu File -> Save simplified report…. The simplified report cannot be imported to estimate MSM and SSM rate, please generate full report if you want to reuse the classification result later. The simplified report directory will look like:
gmmd-simplified-report
├── GMM_simplified.config
└── GMM_simplified.csv
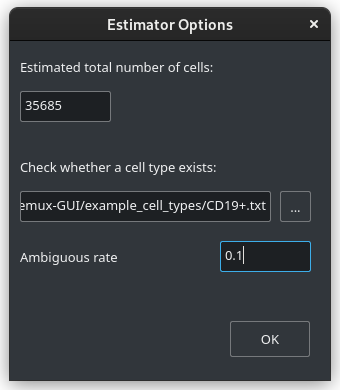
4. Estimate
To run the estimator, either click Estimate on the right-bottom panel, or select from menu Run -> Estimate, or use the keyboard shortcut F8.
In the estimator option window, the estimated total count of cells in the single cell assay is required.
To verify whether a cell type exists, select a text file which should include the list of droplet barcodes of the putative cell type. The ambiguous rate can be adjusted and is 0.05 by default. Leave the file path empty if you do not need this function.
Here is an example screenshot with examination enabled:
The estimation result as well as the examine report will be printed in the Data Summary and Estimation Report tabs. Right click on any region in Estimation Report -> Save summary report or select from menu File -> Save summary report… to store the estimation results in a text file.
5. Plot
After the classification, plot functions are available. Users can view the plot images using system viewer or save to local png file by right clicking the plot section.
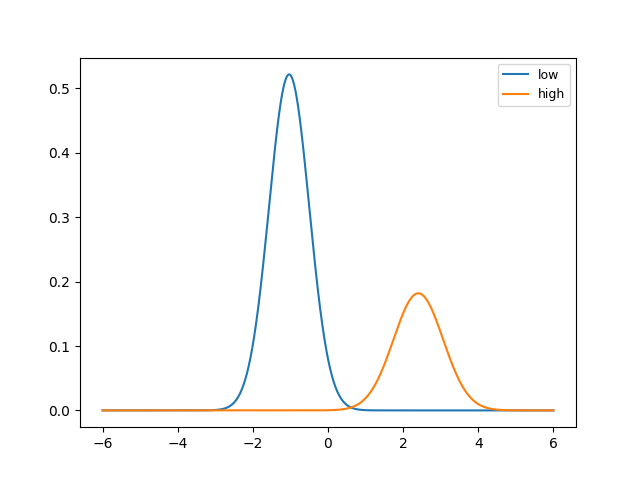
To generate the probability density function plot for a HTO tag, select from menu Run -> Plot -> PDF. Here is an example pdf plot for HTO_1:
To generate the tSNE plot, click the Plot button on the right-bottom panel or select from menu Run -> Plot -> tSNE or use the keyboard shortcut
F7. Here is an example tSNE plot: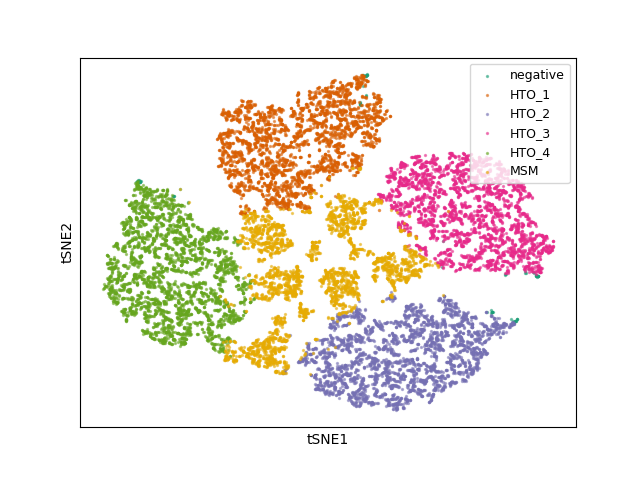
Command Line Tools
This is for advanced users only and support is not gauranteed.
The source code of GMM-Demux is supplied in the gmmd folder.
An example cell hashing dataset is also provided, located in the example_input/outs/filtered_feature_bc_matrix folder.
An example set of hand-curated putative cell types of the above dataset are provided in the example_cell_types folder. Cell types are annotated through manual gating using surface marker expression data.
An example csv format of the above cell hashing dataset is provided as the example_hto.csv file.
- GMM-demux [-h] [-k SKIP] [-x EXTRACT] [-o OUTPUT] [-f FULL] [-c] [-t THRESHOLD] [-s SIMPLIFIED] [-u SUMMARY] [-r REPORT] [-e EXAMINE] [-a AMBIGUOUS] [input_path ...] [hto_array ...]
- Parameters
input_path (str) – The input path of mtx files from cellRanger pipeline.
hto_array (str) – Names of the HTO tags, separated by
,.-h (optional) – Show help information.
-k (str, optional) – Load a full classification report and skip the mtx folder. Requires a path argument to the full report folder. When specified, the user no longer needs to provide the mtx folder.
-x (str, optional) – Names of the HTO tag(s) to extract, separated by
,. Joint HTO samples are combined with+, such asHTO_1+HTO_2.-o (str, optional) – The path for storing the Same-Sample-Droplets (SSDs). SSDs are stored in mtx format. Requires a path argument.
-f (str, optional) – Generate the full classification report. Requires a path argument. Defaults to
SSD_mtx.-c – Take input in csv format, instead of mmx format.
-t (float, optional) – Provide the confidence threshold value. Requires a float in (0,1). Defaults to
0.8.-s (str, optional) – Generate the simplified classification report. Requires a path argument.
-u (int, optional) – Generate the statstic summary of the dataset. Including MSM, SSM rates. Requires an estimated total number of cells in the assay as input.
-r (str, optional) – Store the data summary report. Requires a file argument. Only executes if
-uis set.-e (str, optional) – Provide the cell list. Requires a file argument. Only executes if
-uis set.-a (float, optional) – The estimated chance of having a phony GEM getting included in a pure type GEM cluster by the clustering algorithm. Requires a float in (0, 1). Only executes if
-eexecutes. Defaults to0.05.
Examples
Case 1: Basic Usage, Remove MSMs
Once installed, GMM-Demux is directly accessible with the GMM-demux command.
GMM-demux <cell_hashing_path> <HTO_names>
<HTO_names> is a list of sample tags (HTOs) separated by a comma (,) without whitespace.
For example, there are four sample barcoding tags in the example cell hashing dataset.
They are HTO_1, HTO_2, HTO_3, HTO_4. The <HTO_names> variable therefore is HTO_1,HTO_2,HTO_3,HTO_4.
The non-MSM droplets (SSDs) of the dataset are stored in the GMM_Demux_mtx folder under the current directory by default.
The output path can also be specified through the -o flag.
Example Command
An example cell hashing data is provided in the example_input folder. <HTO_names> can be obtained from the features.tsv file.
GMM-demux example_input/outs/filtered_feature_bc_matrix HTO_1,HTO_2,HTO_3,HTO_4
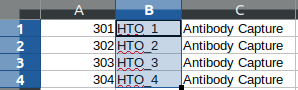
<HTO_names> are included in the features.tsv file. The content of the feature.tsv file is shown below.
Output
The default content in the output folder are the non-MSM droplets (SSDs), stored in MTX format. The output shares the same format with CellRanger 3.0. By default, the output is stored in SSD_mtx folder. The output location can be overwritten with the -o flag.
Case 2: Compute the MSM and SSM rates
To compute the MSM and SSM rates, GMM-Demux requires the -u flag:
-u SUMMARY, --summary SUMMARYGenerate the statstic summary of the dataset. Requires an estimated total number of cells in the assay as input.
The -u flag requires an additional <NUM_OF_CELL> argument, which is the estimated total count of cells in the single cell assay.
Example Command
GMM-demux example_input/outs/filtered_feature_bc_matrix HTO_1,HTO_2,HTO_3,HTO_4 -u 35685
Output
Below is an example report:

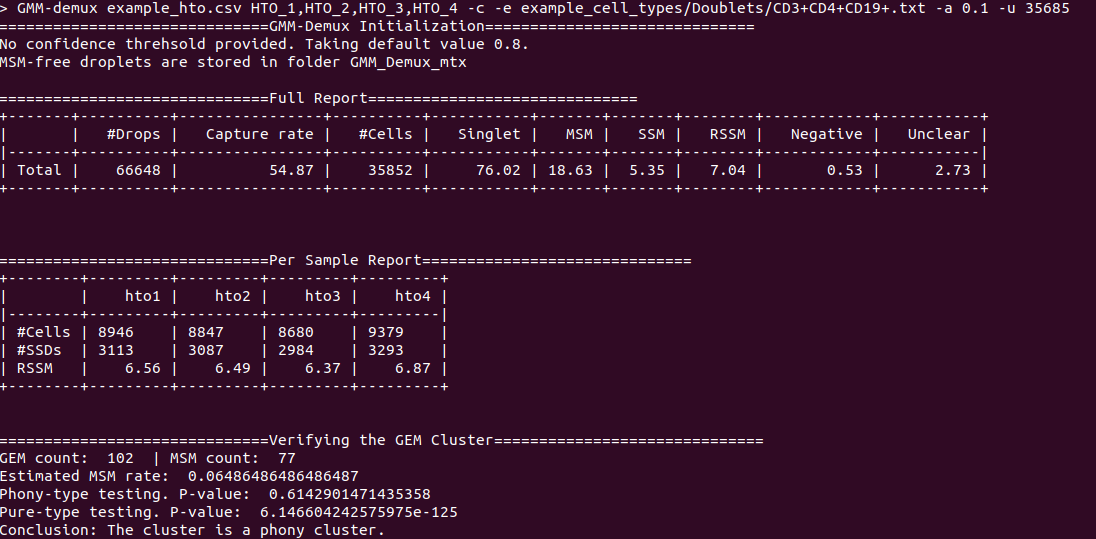
RSSM denotes the percentage of SSMs among the remaining SSDs (after removing all MSMs). RSSM measures the quality of the final cell hashing dataset after removing MSMs.
Case 3: Verify if a cell type exists
GMM-Demux verifies if a putative cell type exists with the -e flag:
-e EXAMINE, --examineEXAMINE Provide the cell list. Requires a file argument. Only executes if -u is set.
The -e flag requires a file name, which stores the list of droplet barcodes of the putative cell type.
Example Command
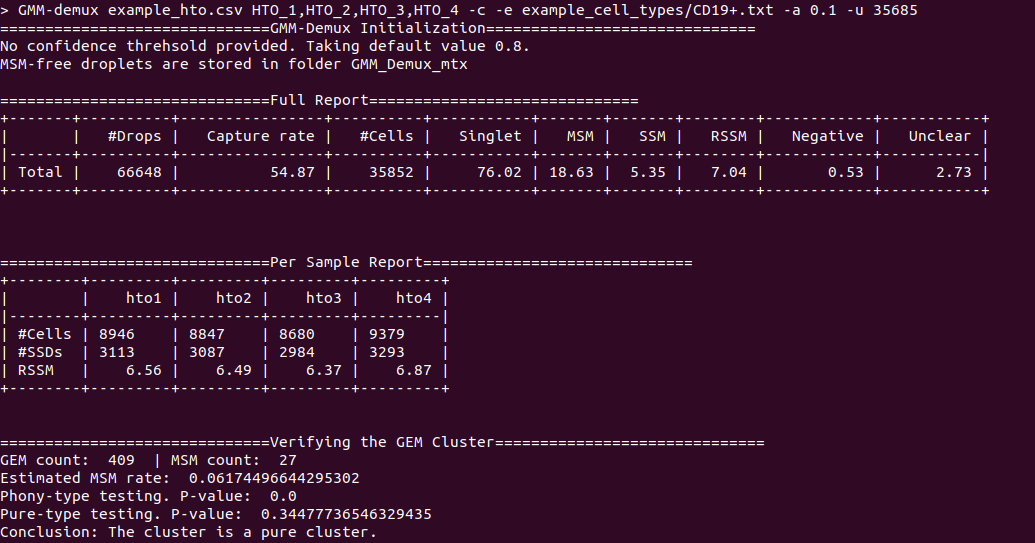
GMM-demux example_input/outs/filtered_feature_bc_matrix HTO_1,HTO_2,HTO_3,HTO_4 -u 35685 -e example_cell_types/CD19+.txt
GMM-demux example_input/outs/filtered_feature_bc_matrix HTO_1,HTO_2,HTO_3,HTO_4 -u 35685 -e example_cell_types/Doublets/CD3+CD4+CD19+.txt
Output
An example output of a pure cell type:
An example output of a phony cell type:
Case 4: Use the csv file format as input, instead of the mtx format
Example Command
GMM-demux -c example_hto.csv HTO_1,HTO_2,HTO_3,HTO_4 -u 35685
Parsing the Classification Output
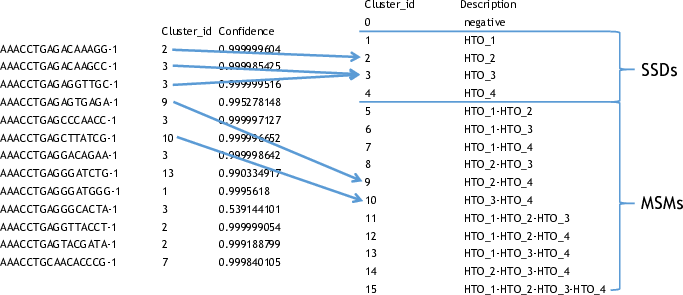
There are two files in a classification output folder. A config file (ending with .config) and a classification file (ending with .csv).
The classification file contains the label of each droplet as well as the probability of the classification. The classification is represented with numbers which are explained in the config file.
Below shows the classification output of the example data:
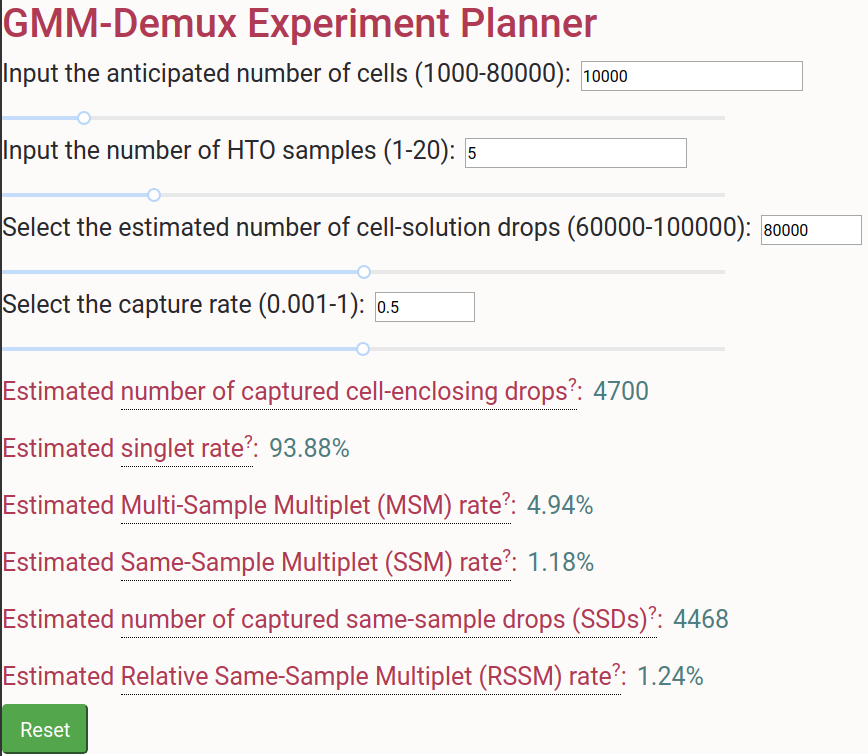
Online Cell Hashing Experiment Planner
A GMM-Demux based online cell hashing experiment planner is publically accessible at here.